An Overview of Our Reporting Tools
Sep 27, 2010
Reporting within DW Event is best explained as three different types of reports. These are:
- Reports on multiple events
- Reports on registrations for each class or other function at the event
- Financial reports that either summarize or give detailed data on revenues received and expenses.
Global Event Report
This shows a snapshot of recent activity per event as well as a detailed report that is customizable so that your Finance Department can quickly extract the details of each transaction for all events in one report.
The generated report (Multiple Event Report) is automatically separated according to event. This report is viewable online and can also be downloaded to excel or other software. In the HTML version of the report there are links to Ticket Detail report and Payment Detail. The reports give line item detail and payment methods detail about the summarized data in the Multiple Event Report.
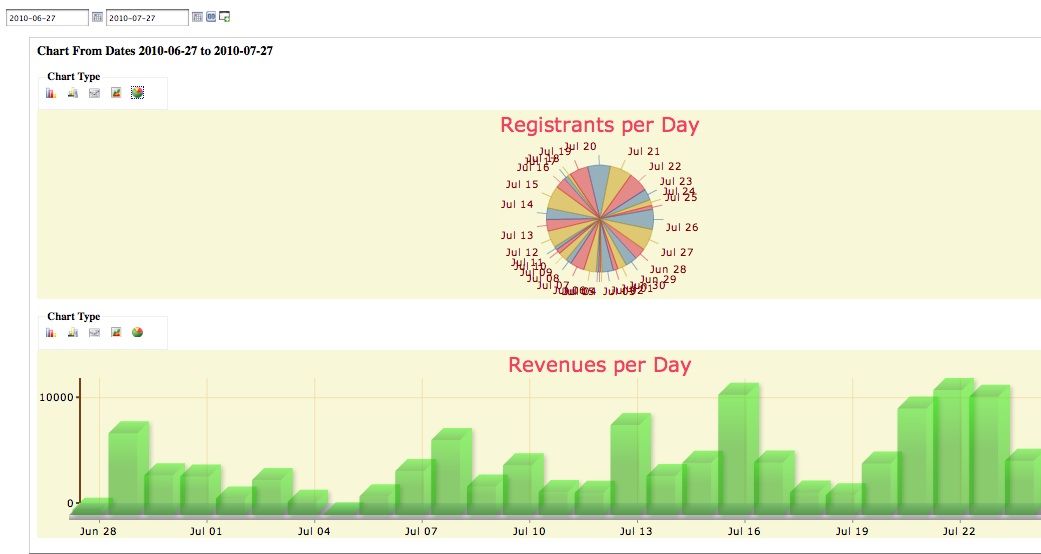
From the Global Event Report you can navigate to the Event Graphs report that shows visual graphs of:
- Registrants per day
- Revenues per day
- Email blast graphs on a per blast basis
- Event website traffic such as page views for your landing page, people registered, personal itinerary views, articles viewed about the event in the publisher module, social website (Facebook, LinkedIn, Twitter, etc.) views, and so forth.
The Event Graphs are normally used by management.
From the Global Event Report you can also navigate to the Quick Report. This report is used mostly by the event planners to
- Monitor registrations by registration type
- View the current number of attendees per session
- View attendance rates after the event.
The report is interactive and allows you to update the maximum class size or allowed number or registrants per class. The report also allows you to quickly generate rosters on a per class basis.
From the Global Event Report you can also navigate to the Printing and Reports tool. This tool allows you generate detailed financial reports, rosters, bulk badges, tickets, mailing labels and more.
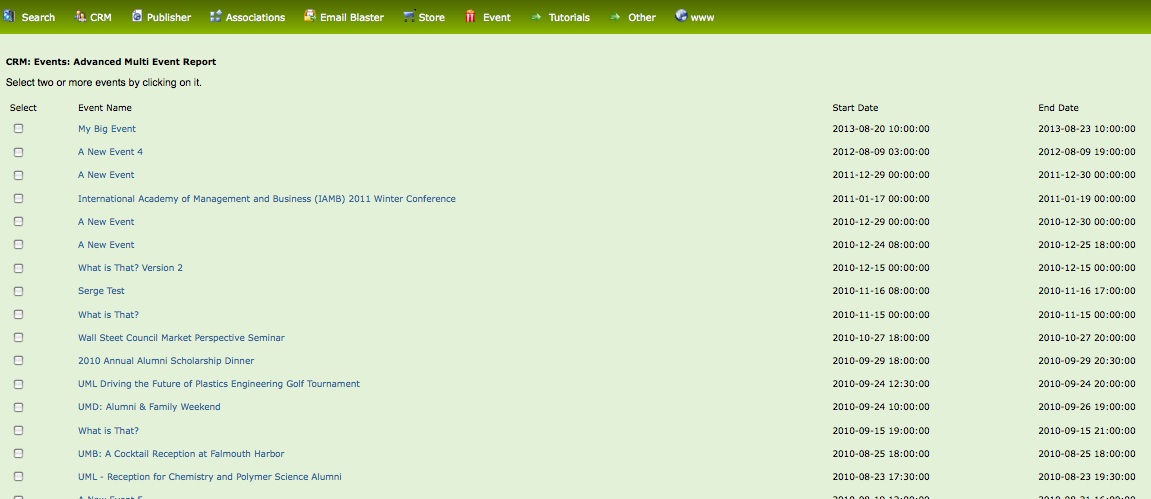
Advanced Multi-Event Report allows to you view summarized data about registrations for multiple events. This reporting tool allows you to select two or more events you have on our system for which it will summarize how many people attended one, several, or all of the events loaded in your system. This report helps you to see how many registrants are returning each year, for example.
Event Overview Report is a graphical (pie charts) and summarized report on the number registrants that had complimentary registrations versus paid registrations and then number of attendees per day.
Our Financial Reports Tool produces various reports across all your events and also (optionally) for your online store. These reports are based on date range. Some of the more popular reports are:
- Daily Total
- Monthly Total
- Refunds
- Pending (dropped registrations)
- Hourly Total
Page
1 of 1
 Create Discussion
|